What does a credit rating indicate in terms of actual default risk?
A credit rating is best thought of as a probability-of-default signal, not a guarantee. Rating agencies assess an issuer’s ability and willingness to meet obligations based on business strength, balance sheet, cash flows, industry conditions, and governance. But defaults are ultimately driven by what happens in the future—economic cycles, sector shocks, liquidity conditions, policy changes, and company-specific events—so historical default rates are only an indicator, not a prediction (and ratings can change as conditions evolve).
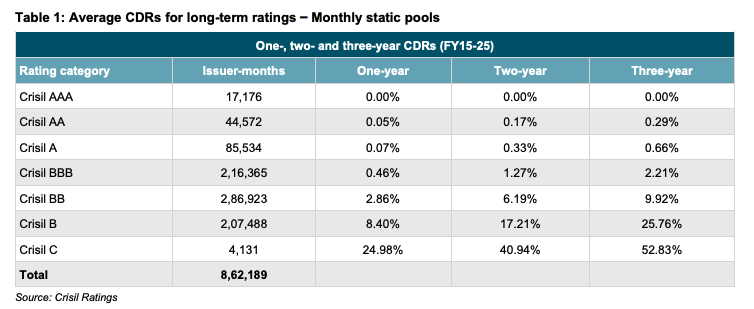
That said, if you want a practical sense of what ratings have meant historically in terms of realised defaults, default studies are a useful reference point. For example, the CRISIL default data (FY15–FY25 monthly static pools) shows that 3-year cumulative default rates rise sharply as you move down the rating ladder—approximately AAA: 0.00%, AA: 0.29%, A: 0.66%, BBB: 2.21%, then stepping up meaningfully in lower ratings (BB: 9.92%, B: 25.76%, C: 52.83%). In simple terms: higher ratings have historically translated into materially lower default incidence over a 3-year window, while lower-rated credit carries a meaningfully higher chance of default.
The right way to use this is as a baseline calibration: in the absence of deeper issuer-level analysis, default-rate history helps translate “AAA vs A vs BBB” into a rough sense of relative default risk. But investors should still treat it as directional—because the next stress cycle can look very different—and combine it with portfolio safeguards like diversification, maturity matching, liquidity planning, and avoiding excessive yield-chasing.