Market Leadership Change: Why Chasing the Last Winner Is Usually a Mistake
One of the most persistent mistakes in investing is to assume that the market leaders of the recent past will remain the leaders of the future. They often do not. Market leadership changes, sometimes gradually and sometimes abruptly, yet investors regularly build portfolios as if long periods of outperformance are proof of permanence. That complacency is especially visible today in portfolios heavily concentrated in India and the US, where strong returns over the last decade have made diversification feel less necessary than it really is.
The chart tells a story many investors prefer to ignore: market leadership changes. Often sharply. Often unexpectedly. And usually after investors have convinced themselves that the recent winner is somehow different.
That is how complacency gets built into portfolios.
For the last 10–15 years, investors linked to India and the US have had a particularly easy time believing concentration is justified. If you were heavily exposed to US equities, especially technology, or to India, recent history has rewarded you. But that is precisely the point. Long stretches of outperformance often make investors less analytical, not more. They stop asking what is driving returns and start assuming the same forces will persist.
History gives us very little reason to be that comfortable.
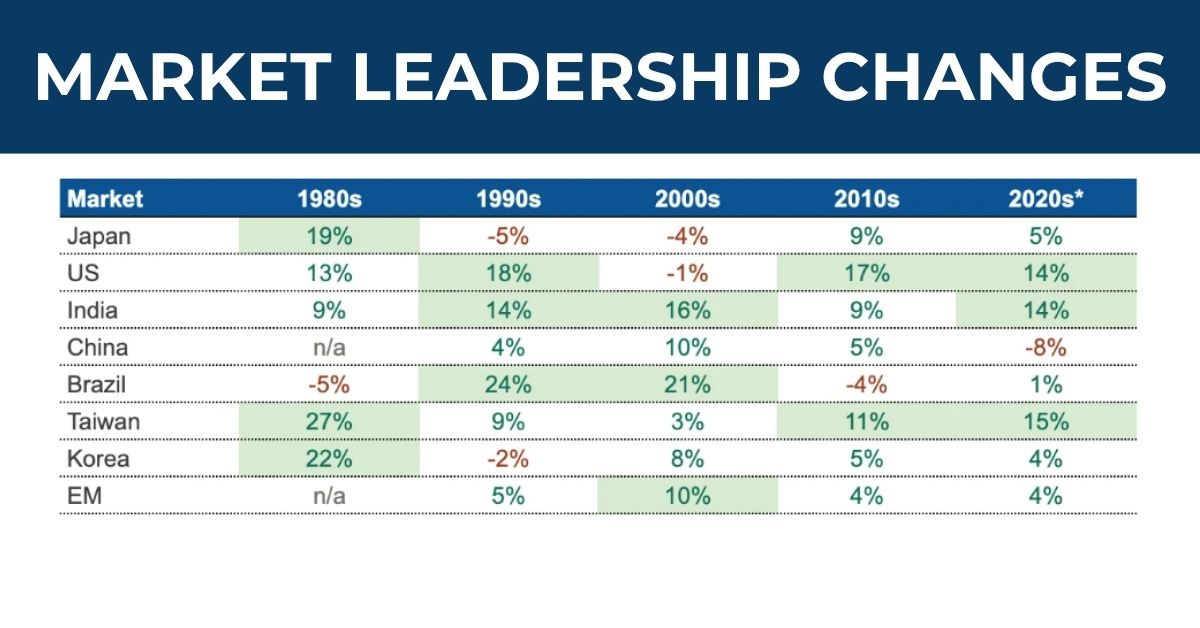
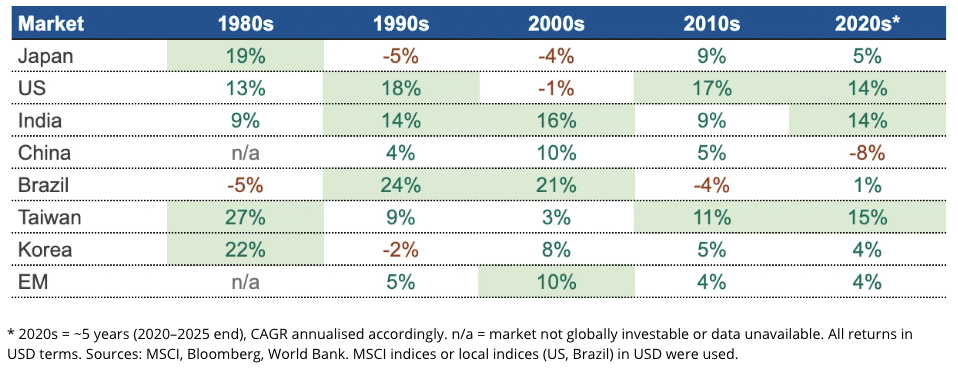
The chart is clear: leadership rotates
Look across the decades and the pattern is obvious.
In the 1980s, Asia dominated. Japan returned 19%, Taiwan 27%, and Korea 22% annually. Export-led industrialisation was working, capital was flowing, and Japan in particular saw an extraordinary repricing of financial assets.
Then came the 1990s. Japan fell to -5%. Korea dropped to -2%. The Asian crisis hit the region. Meanwhile, the US returned 18% on the back of the dot-com boom, while India (14%) and Brazil (24%) benefited from liberalisation and economic stabilisation.
Then the pattern changed again.
In the 2000s, the BRICS trade took over. India returned 16%, Brazil 21%, China 10%, and EM broadly 10%. The US, after dominating the 1990s, delivered -1% annual returns. Japan remained weak at -4%.
Then the 2010s flipped the script again. The US returned 17%, led by technology. India was solid at 9%, but not dominant. Brazil fell to -4%. China, despite all the excitement around it, delivered only 5% and became increasingly disappointing toward the end of the decade.
In the 2020s so far, the winners have again been selective: US equities at 14%, India at 14%, Taiwan at 15%. China, by contrast, is at -8%.
The lesson is simple: global market cycles do not move in straight lines, and recent winners are often poor guides to future leadership.
Why market leadership changes
If investors want to avoid being misled by the past, they need to understand why market leadership changes in the first place.
1. Strong stories get overpaid for
A good market can still be a bad investment if expectations become excessive.
That was true of Japan at the end of the 1980s. The underlying economic story was real. But prices went too far. Once that happens, even good fundamentals are not enough.
This is one of the most common mistakes investors make: they identify a genuine success story, then assume that because the story is true, the return opportunity must still be attractive. Those are not the same thing.
2. Cycles turn
Some periods are driven by export booms. Others by commodities, liquidity, rates, reform, or technology.
Brazil is a good example. It returned 21% annually in the 2000s, helped by the BRICS narrative and a strong commodity backdrop. In the 2010s, that gave way to a commodity bust and political instability, and returns fell to -4%.
Investors often mistake cyclical strength for structural superiority. That is a costly confusion.
3. Policy matters more than investors admit
Reform can unlock a market for years. Policy mistakes can close that window just as quickly.
India’s stronger decades cannot be separated from liberalisation and a more credible macro framework. China’s weakness in the 2020s cannot be understood without regulatory tightening and deleveraging.
Country investing is never just about growth. It is about whether growth translates into shareholder returns. Policy is often the bridge between the two.
The real issue today: complacency
The most important takeaway from the chart is not simply that leadership changes. It is that long periods of leadership create dangerous investor behaviour.
Today, that behaviour is most visible in portfolios concentrated in:
- US equities, especially large-cap technology
- India
- and, in many cases, a combination of both with very little else
We understand why. The case for both has been strong. The US has had world-class technology businesses, superior capital markets, and stronger profit growth than most peers. India has benefited from structural reform, formalisation, digitalisation and relatively resilient domestic growth.
But that only explains the past. It does not guarantee the future.
What concerns us is the portfolio behaviour that strong past performance has encouraged. Investors in the US increasingly behave as if global diversification is optional. Investors in India often behave as if home bias is not a risk because the home market has earned their confidence. In both cases, concentration starts to feel sensible simply because it has recently been rewarded.
That is usually the point at which discipline weakens.
Looking at the past is often directionally wrong
The chart offers repeated examples of how dangerous backward-looking investing can be.
- Asia looked unstoppable in the 1980s. That would have been a painful assumption to carry into the 1990s.
- The US looked unbeatable in the 1990s. The 2000s then delivered -1% annual returns.
- Brazil and the BRICS story looked compelling in the 2000s. The 2010s were a reminder that strong narratives can age badly.
- China was treated by many investors as the inevitable long-term winner. The 2020s so far have challenged that view hard.
This is the central investing mistake: using recent winners as a shortcut for future opportunity.
What matters more is not who led last, but why they led:
- Was it valuation rerating?
- Was it earnings?
- Was it liquidity?
- Was it reform?
- Was it a cycle that may now be fading?
Without answering those questions, performance history becomes more misleading than useful.
What investors should do instead
The practical lesson is not to abandon conviction. It is to be more demanding about where that conviction comes from.
A better framework is to ask:
- What is already priced into the current favourites?
- Which return drivers from the last decade are still intact?
- Where is the portfolio concentrated, even if it does not feel concentrated?
- Are we owning this market because the future is attractive, or because the past has been comforting?
Those questions matter more than any decade leaderboard.
Conclusion
The decade return chart is a useful corrective to one of the most persistent errors in investing: extrapolation.
Market leadership change is normal. What worked in one decade often fails in the next, not because the market was “bad,” but because valuations, cycles, policy and expectations all change.
That is especially relevant now. After a long period in which US tech, US equities and India have dominated, many investors have come to treat concentration as rational rather than risky. We would be careful with that.
The chart does not tell us exactly who will lead next. But it does tell us something important: building a portfolio around the recent past is one of the most reliable ways to be surprised by the future.
Experience the benefits of working with a 'research-first' investments firm
Free 15-Day Trial of IME RMS App
Enjoy a complimentary 15-day trial of IME RMS and 3 1-hour consultations with a Senior Private Banker.
Access IME’s central research insights across MFs, PMSs, AIFs, SIFs and global funds, along with personalised support on risk profiling, mandate design, financial planning, and a portfolio review.
Experience the difference a research-first, transparent approach can make to your wealth journey.