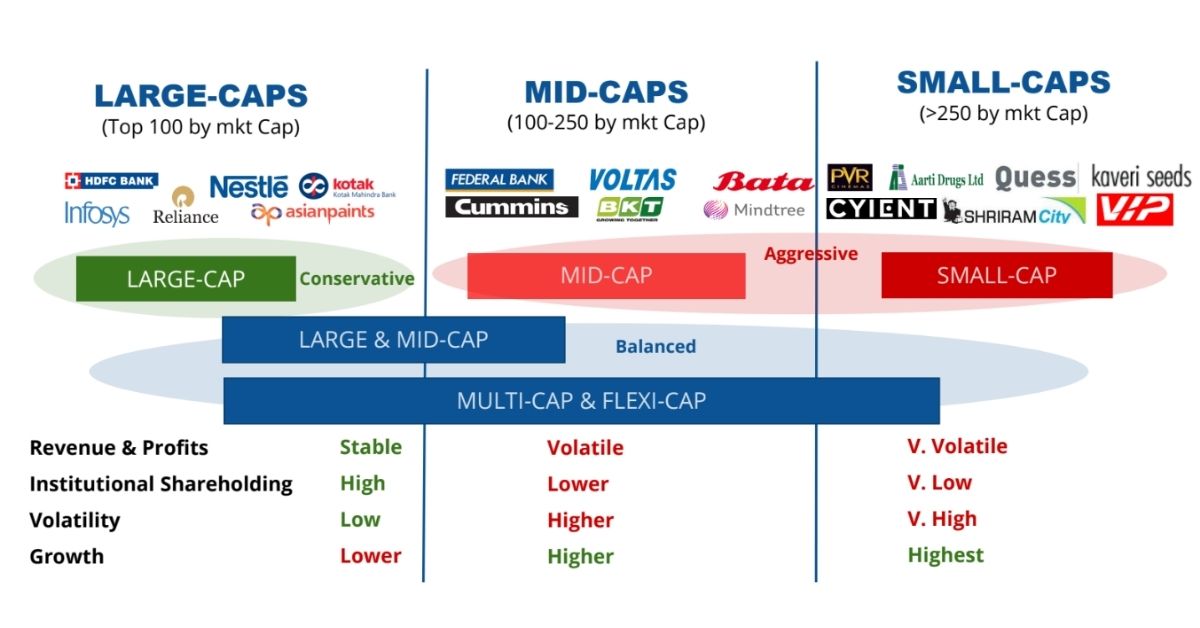
Largecap vs Midcap vs Smallcap: Understanding their relative risk-return
Markets are cyclical in nature driven by economic and business cycles further exaggerated by the psychology/behaviour of the market participants. While such market volatility impacts all segments of the market, the extent of volatility in mid & small-caps are substantially higher (leading to sharp outperformance in bull markets & sharp corrections in bear markets).
Over the longer-term, mid & small-caps would outperform large-caps, but this comes with a high degree of volatility. This makes them more suitable for aggressive investors, and also a segment to be careful about in terms of capital losses during bear markets.
Large, Mid and Small Caps Across Various Cycles
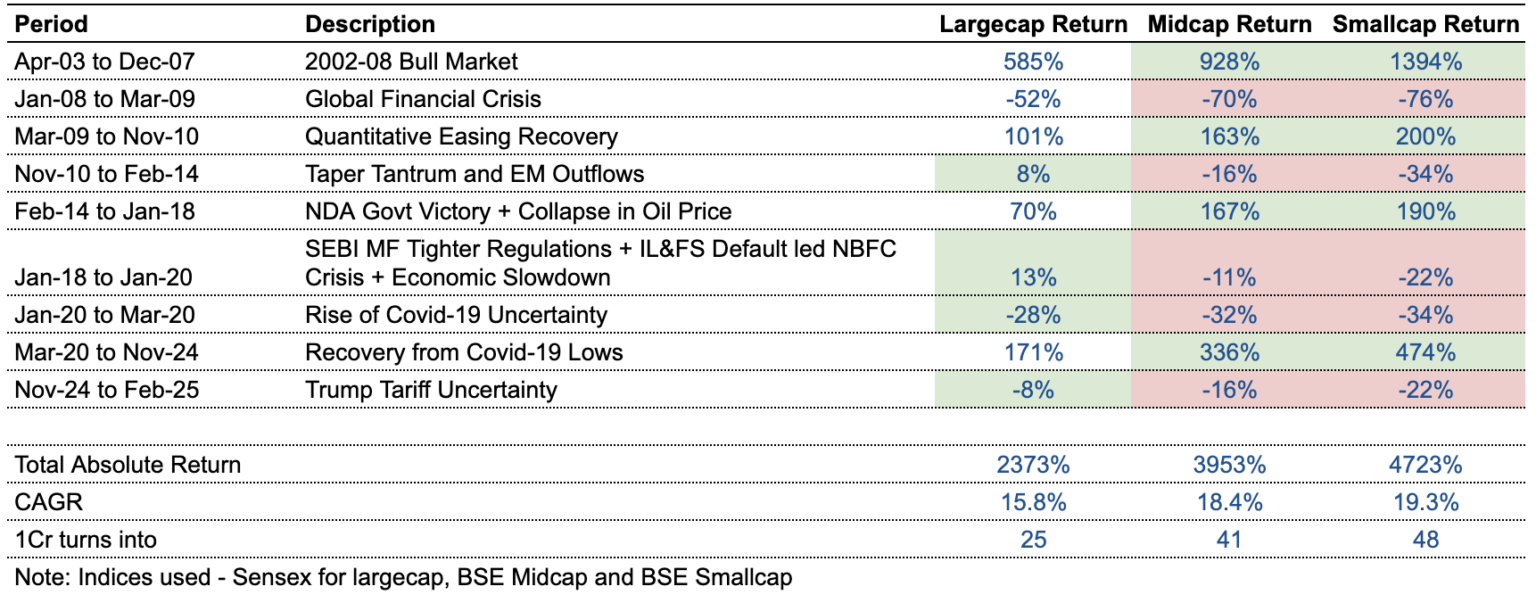
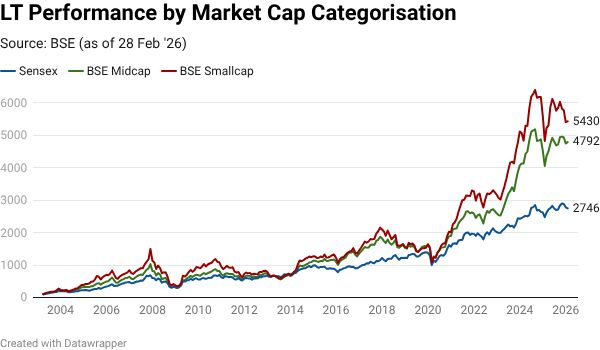
From April 2003 through Dec 2021, Indian markets have witnessed 8 bull and bear market phases, indicating 4 complete market cycles. In this blog, we study the relative performance of large, mid & small-caps across these different market cycles, to provide investors a better understanding of the relative risk-return across these 3 major market-cap categories.
April 2003 to Dec 2007 | Global Bull Market led by Infra, Cap Goods and a booming RE market
During one of the strongest bull markets that Indian equities have seen, the outperformance of mid and small cap is very significant due to strong earnings growth on the back of strong economic and business uptick.
Strong Outperformance led by Earnings Growth and Eventually Valuation Re-rating
Midcaps have returned ~930% (1.6x of large cap) and small caps have returned ~1400% (2.4x large cap) over this ~5 year period.
Jan 2008 to Mar 2009 | Global Financial Crisis
While the outperformance of mid and small caps was very strong in the previous period, the global financial crisis has led to a significant correction.
This undoing of mid and small-cap correction was led by valuation de-rating and a higher impact on earnings relative to stable businesses in large caps.
Deep Correction in Markets Led by Mid and Small Cap Companies
Midcaps have corrected 62% and small caps have corrected 68% over this 13-month period. During the same, the correction in large-cap small was relatively lower at 45%.
Mar 2009 to Nov 2010 | Recovery from GFC
With central banks coming to the rescue, the stimulus of quantitative easing around the world has helped economies from facing severe depression.
Mid and Small Caps Outperformed on the back of Quantitative Easing
During this recovery albeit short, the mid caps have outperformed with 163% returns (1.6x large caps) and small caps have outperformed with 200% returns (2x large caps) over the 9-month period.
Nov 2010 to Feb 2014 | Taper Tantrum and EM Outflows
Post the initial quantitive easing with a pullback in economic growth, a surprise announcement from the US Fed of slowing down bond purchases led to investors’ concerns over a potential recession, which marked a huge outflow from emerging market equities impacting the balance of payment and currency.
Taper Tantrum led EM Outflows
During this volatile period, mid and small caps have underperformed significantly with a 16% and 34% correction respectively over the 4-year period. However, large-cap over the same period have returned 8%.
Feb 2014 to Jan 2018 | Oil Price Collapse, Economic Recovery and NDA Victory
With the taper tantrum easing, the global markets between mid-2014 and early 2016, witnessed one of the largest oil price declines in modern history driven by a growing supply glut. Along with domestic factors such as the majority win by the NDA govt and recovering domestic economy, the Indian market has shown a strong recovery led by govt spending on infra and private consumption.
Strong Economic Recovery
Midcaps and small caps have outperformed with 167% and 190% (2.4x and 2.7x large-cap returns) over the 4 years period.
Jan 2018 to Jan 2020 | SEBI MF Tighter Regulations + IL&FS Default led NBFC Crisis + Economic Slowdown
While Indian economy growth was strong, certain technical factors such as tighter SEBI mutual fund regulations have led to the beginning of the mid and small cap correction. This was further exaggerated by the previous period’s economic policies such as demonetisation, GST, and RERA (initially deflationary in nature) and the collapse of IL&FS triggering a tightening in bond markets for NBFCs.
SEBI Regulations, IL&FS Default and Economic Slowdown
Midcaps and small caps have underperformed with an 11% and 22% correction during this 2-year period. However, as seen from previous cycles, large-caps outperformed with a 13% return over the same period.
Jan 2020 to Mar 2020 | Covid Impact
While Covid-19 was first spotted in China, the implications of the virus were still unknown. With a global breakout, the health crisis had led to a lockdown around the globe bringing economic activity to an arrest.
Covid-19 Impact
All sections of the markets have correction during this period, with 32% mid cap correction, 34% small cap correction and marginally better 28% large cap correction.
Mar 2020 to November 2024 | Recovery from covid lows
During the peak of uncertainty, the global central banks and governments have helped stabilise the economic impact with unprecedented stimulus. Post the stabilisation of the economies around the world, growth remains resilient despite inflationary concerns. India witnessed a revival of capex aided by both the government and private sector.
Covid Recovery
Mid and small caps have returned 136% (1.4x large caps) and 207% (2.1x large caps) respectively over the ~18-month period.
Nov 2024 to Feb 2025 | Domestic Economic Slowdown and Trump Tariff Uncertainty
This pullback has coincided with a slowdown in earnings growth, concerns over global economic stability amid the ongoing tariff war, and continued FII outflows.
Domestic Slowdown, Strong Dollar, US Tariffs, Higher 10yr US Treasury Yields and FII Outflows
A key uncertainty remains Donald Trump’s tariff policy.
Conclusion
From the data above, since 2003, we can clearly see the higher volatility in small and mid-cap companies due to associated reasons such as volatile earnings, less-established business models and management quality. Large-caps are relatively stable with established business models and usually better management in place.
Mid & Small-caps have higher potential returns, but with clearly higher risk
This makes them more suitable for more aggressive investors, and investors that are willing to overlook higher potential volatility in returns over the shorter-term.
Experience the benefits of working with a 'research-first' investments firm
Free 15-Day Trial of IME RMS App
Enjoy a complimentary 15-day trial of IME RMS and 3 1-hour consultations with a Senior Private Banker.
Access IME’s central research insights across MFs, PMSs, AIFs, SIFs and global funds, along with personalised support on risk profiling, mandate design, financial planning, and a portfolio review.
Experience the difference a research-first, transparent approach can make to your wealth journey.